Critique 264:Association Between Daily Alcohol Intake and Risk of All-Cause Mortality. A Systematic Review and Meta-analyses
Authors
Zhao J, Stockwell T, Naimi T, Churchill S, Clay J, Sherk A. JAMA Network Open. 2023;6(3):e236185. doi:10.1001/jamanetworkopen.2023.6185
Author’s abstract
Importance A previous meta-analysis of the association between alcohol use and all-cause mortality found no statistically significant reductions in mortality risk at low levels of consumption compared with lifetime non-drinkers. However, the risk estimates may have been affected by the number and quality of studies then available, especially those for women and younger cohorts.
Objective To investigate the association between alcohol use and all-cause mortality, and how sources of bias may change results.
Data Sources A systematic search of PubMed and Web of Science was performed to identify studies published between January 1980 and July 2021.
Study selection Cohort studies were identified by systematic review to facilitate comparisons of studies with and without some degree of controls for biases affecting distinctions between abstainers and drinkers. The review identified 107 studies of alcohol use and all-cause mortality published from 1980 to July 2021.
Data extraction and synthesis Mixed linear regression models were used to model relative risks, first pooled for all studies and then stratified by cohort median age (<56 vs56 years) and sex (male vs female). Data were analysed from September 2021 to August 2022.
Main outcomes and measures Relative risk estimates for the association between mean daily alcohol intake and all-cause mortality.
Results There were 724 risk estimates of all-cause mortality due to alcohol intake from the 107 cohort studies (4 838 825 participants and 425 564 deaths available) for the analysis. In models adjusting for potential confounding effects of sampling variation, former drinker bias, and other prespecified study-level quality criteria, the meta-analysis of all 107 included studies found no significantly reduced risk of all-cause mortality among occasional (>0 to <1.3 g of ethanol per day; relative risk [RR], 0.96; 95%CI, 0.86-1.06; P = .41) or low-volume drinkers (1.3-24.0 g per day; RR, 0.93; P = .07) compared with lifetime non-drinkers. In the fully adjusted model, there was a non-significantly increased risk of all-cause mortality among drinkers who drank 25 to 44 g per day (RR, 1.05; P = .28) and significantly increased risk for drinkers who drank 45 to 64 and 65 or more grams per day (RR, 1.19 and 1.35; P < .001). There were significantly larger risks of mortality among female drinkers compared with female lifetime non-drinkers (RR, 1.22; P = .03).Conclusions and relevance In this updated systematic review and meta-analysis, daily low or moderate alcohol intake was not significantly associated with all-cause mortality risk, while increased risk was evident at higher consumption levels, starting at lower levels for women than men.
Forum comments
Background including previous results
The notion that low-dose alcohol use (moderate alcohol consumption) protects against all-cause mortality in general populations continues to be made controversial. Observational studies show that moderate drinkers have longer life expectancy mainly because moderate drinkers are less likely to die from cardiovascular diseases than abstainers (Di Castelnuovo et al., 2022; Song et al., 2018). Approximately 35 years of systematic reviews and meta-analyses of this literature generally confirm J-shaped risk curves, that is, protective associations at low doses with increasing risk at higher doses (Di Castelnuovo et al., 2002, 2006, 2021). Consumption of up to 20 g alcohol/day for both men and women was associated with lower all-cause mortality than zero consumption, was associated with a reduced risk of all-causes, with approximately 5 g/day associated with the lowest mortality risk.
These meta-analyses have also adjusted for all known confounders. One of the earliest confounders recognized by epidemiologists was that some of the “non-drinkers” no-alcohol reference group in their studies contained former heavy drinkers, and had stopped drinking due to adverse health effects.
Forum Member Stockley states that “Scientists then began to collect precise data on previous drinking, to better control for drinking pattern (previous intake, regular versus binge drinking), smoking, physical activity, obesity, and other risk factors for disease and mortality. In almost every well-conceived and controlled study done, it was found that when ex-drinkers were not included in the referent group (and the group consisted only of lifetime abstainers) and other known confounders were also adjusted for, there was still a strong “J-shaped curve” for CVD and mortality for moderate drinkers. This pattern has been found consistently in studies from North and South America, Europe, and Asia, in cultures where alcohol consumption varies from the occasional subject to the large majority of people (Ronksley et al., 2011). All these studies have consistently shown that there is a cardioprotective effect for regular light to moderate alcohol consumption contributing significantly to a reduced all-cause mortality for light to moderate drinkers (Kono et al., 1986, Cullen et al., 1993, Tsubono et al., 1993, Thun et al., 1997, Rehm et al., 2001, Makela et al. 2005, Di Castelnuovo et al., 2002, 2006, 2021, Perreault et al., 2006, 2017, Friesema et al., 2007, Sadakane et al. 2009., Sun et al., 2009, Huang et al., 2014, Bergman et al., 2013, Ferrari et al. 2014, Jayasekara et al., 2015, Xi et al., 2017, Kunzmann et al., 2018, Colpani et al., 2018, Kapiro et al., 2019, Daya et al., 2020, Härkännen et al., 2020, Li et al., 2020, Van den Brandt and Brandts, 2020, Zhang et al., 2021, Barbería-Latasa et al., 2022)”.
J-shaped curves are more often observed in epidemiology than linear relationships because of multiple determinants or risk factors for diseases. Therefore, there will always be an optimum between risk factors and disease outcomes. Accordingly, the consistently observed J-shape between alcohol consumption and all-cause mortality is probably not the result of a methodological flaw. Examples include the J-shaped association between body mass index (BMI) and stroke (Liu et al., 2018), an association which is extended to all-cause mortality after adjusting for potential confounders such as alcohol consumption and smoking (Berrington de Gonzales et al., 2010). Even in patients with non-communicable diseases the association between BMI and mortality is J-shaped. The association between blood pressure (BP) and mortality is also J-shaped both in treated and untreated patients (Boutitie et al., 2002, Sims et al. 2014).
The current paper by Zhao J., Stockwell T., Naimi T., Churchill S., Clay J., Sherk A., (2023) is a follow-up paper to two published previously by this group trying to undermine the well-established J-shaped association between moderate alcohol consumption, cardiovascular disease and all-cause mortality. The first paper written by Filmore et al. (Fillmore et al., 2007) re-iterated the old and already falsified hypothesis that the J-curve would be generated by “sick quitters” or badly categorized moderate drinkers. The “sick quitters” hypothesis was duly discredited by reanalysis of the studies (Klatsky and Udaltsova, 2007). Also repeat studies adjusting for the claimed bias still showed a cardioprotective effect for regular light to moderate alcohol consumption (Di Castelnuovo et al., 2006, Ronksley et al., 2011).
The second paper written by Stockwell et al. (2016) was previously critically reviewed by ISFAR. Forum members noted that the authors were very selective in choosing papers to include in their new analyses: they identified 2,575 studies on the subject, analysed 87, but then found some reason to exclude almost all of these studies to reach a conclusion that “ . . . there was no significant protection of all-cause mortality for low-volume drinkers (RR = 1.04, 95% CI [0.95, 1.15]) ” based on what is apparently only six (6!) remaining studies. Their new analysis markedly distorted the accumulated scientific evidence on alcohol and CVD and mortality. As stated by one Forum member, “The biased selection of studies that are included undermines the value of the paper, but more importantly promulgates misinformation in the name of appropriate scientific method. Failure to acknowledge the robust body of knowledge that supports the opposite conclusion, and disqualification of extensive studies that offer plausible biologic explanation of observed benefits, is unconscionable.”
Furthermore, Forum Member Hendriks remarks that this series of three papers ignores the immense amount of experimental data, not only animal experiments but trials in humans, that have described the mechanisms by which moderate alcohol consumption have been shown to decrease essentially all of the risk factors for cardiovascular disease, including low HDL-cholesterol, elevated LDL-cholesterol, endothelial dysfunction, coagulopathies, inflammation, abnormal glucose metabolism, and many others (Brien et al., 2011, Ronksley et al., 2011, Hendriks, 2020). The consistent finding of lower cardiovascular disease risk among moderate drinkers in all well-done cohort studies is strongly supported by experimental evidence of the mechanisms.
Comments on current methodology
Zhao et al. (2023) have [again] biased their meta-analysis by ‘cherry picking’ a small number of studies for their meta-analysis.
Zhao et al. (2023) is published in the prestigious journal JAMA Open Network, basically with the same topic including 87 studies from their 2016 publication and adding 20 relatively recent studies to the meta-analysis which met the same inclusion criteria of the second paper. Unfortunately, a number of older epidemiologic studies utilising a potentially biased no-alcohol reference group continued to be included in the 2023 analysis also. The criticisms of the methodology of the 2016 analysis also hold for this 2023 meta-analysis which overlaps on the same body of evidence, and investigates the same hypothesis using the same methodology.
Zhao et al. (2023) have misrepresented the study as an original investigation.
This third paper is presented as an original investigation, the stated purpose of which is to show how sources of bias may change results. How is this different from the stated purpose of the second paper which was to determine whether misclassifying former and occasional drinkers as abstainers and other confounders underlie observed positive health outcomes for low volume drinkers in prospective studies of mortality?
A selected group of studies were analysed that related reported consumption to mortality. Of these 20 newly included papers, approximately half clearly supported a J-shaped association between alcohol and all-cause mortality (Perreault et al. 2017, Syden et al., 2017, Kunzmann et al., 2018, Saito et al., 2018, Keyes et al., 2019, Daya et al., 2020, van der Luiygaarden et al., 2020, di Castelnouvo et al., 2021, Zhang et al., 2021). Why these specific J-shape supportive studies were chosen and others were not, has not been motivated by the authors. For example, Kunzmann et al., (2018) in a population-based cohort study using data from 99,654 adults (68.7% female), aged 55-74 years, participating in the U.S. Prostate, Lung, Colorectal, and Ovarian (PLCO) Cancer Screening Trial, strongly supported a J-shaped association between alcohol and mortality, which remains even after adjustment for cancer risk. The results indicate that alcohol consumption below 1 drink/day was associated with the lowest risk of death.
Zhao et al. (2023) have reported erroneous and misleading conclusions.
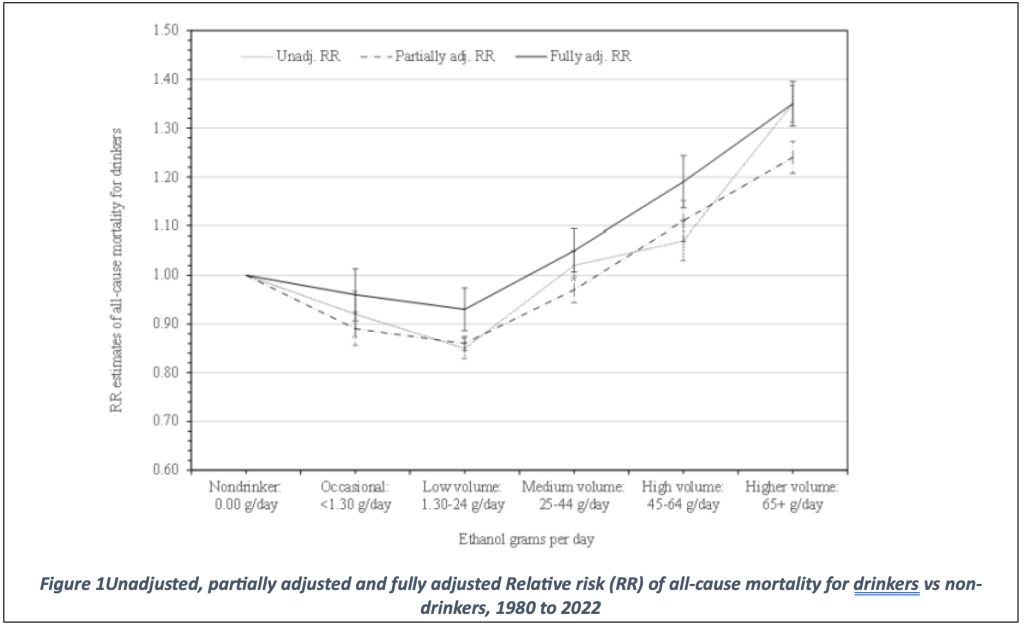
They concluded that “in this updated systematic review and meta-analysis, daily low or moderate alcohol intake was not significantly associated with all-cause mortality risk…”. The supplemental online content, however, clearly shows in eFigure 4 (included below) that adjusted and unadjusted relative risks both show a J-shaped curve for alcohol consumption and all-cause mortality.
The data have been adjusted for many different variables. The unadjusted relative risks showed the classical J-shape. Surprisingly, even the fully adjusted relative risk showed a J-shaped curve as well: a significantly reduced relative risk for all-cause mortality for those drinking a ‘low volume’, namely 1.30 -24 g/day. The authors, however, state that in their fully adjusted model “daily low or moderate alcohol intake was not significantly associated with all-cause mortality risk” and provide a risk estimate of 0.93 (CI: 0.85-1.01). This discrepancy between figure and text is not addressed by the authors. It is amazing that this discrepancy has not been noted by the reviewers and editors of JAMA Network Open. One wonders if reviewers and editors have read this paper in detail, a first task of reviewers would be to check whether the data support the conclusions. The editors have missed the fact that data and procedures, which were essential to derive at their conclusions have been transferred to the supplemental materials. This makes it impossible to grasp the authors approach from what was written in the original JAMA paper.
Even the Global Burden of Disease study (Bryazka et al., 2022) showed that low to moderate (5-17 g alcohol per day) drinking does not increase risk of 22 selected health outcomes, overall, there is even some benefit at low level drinking. This study indicates that the theoretical minimum risk exposure level lies at 5 g alcohol per day and may lie between 2 and 20 g alcohol per day, whereas the non-drinker’s equivalent lies at 17 g alcohol per day and may lie between 10 and 35 g alcohol per day. Although this study previously (Griswold et al., 2018) found that the global theoretical minimum risk exposure level was zero standard drinks per day, the same group found in this recent updated study that the global theoretical minimum risk exposure level was above 0.
Zhao’s fully adjusted model includes adjustments for between-study variation, abstainer biases, sex, country in which a study was conducted, study publication year, follow-up years, drinking pattern, and whether studies controlled for heart problem, social status, race, diet, exercise, body mass index, and smoking status. Some of these factors are well-known confounding factors such as smoking, diet, exercise, body mass index, but some of the factors adjusted seem irrelevant and are not motivated by the author. These adjustments include between-study variation, abstainer biases, country in which the study was conducted and study publication year. It is also unclear how these adjustments have been made. Apart from the fact that this study does not contain any new aspect, the study outcomes are a direct result of the author’s modelling assumptions and the methods used to recode data from the original study resources.
Inaccurate recoding by Zhao et al. (2023).
Recoding appears to be inaccurate as there are inconsistencies when the original study’s adjustments are compared with the data provided in eTable 1. For example, Bobak et al., (2016) adjusted their model for age, education, marital status, economic activity, asset score, subjective hardship score, smoking, physical activity, BMI, prevalent cardiovascular disease and cancer, and depressive symptoms. Bobak et al., (2016) also presented separate risks for men and women. The authors of the JAMA paper claim that they control only for age, sex, race, smoking, and an illness exclusion. Zhao et al. (2023) did not specify these adjustments in their table and may, therefore, have over adjusted for physical activity/exercise, BMI and social status.
Table 1 in the JAMA paper (not shown here) provides the characteristics of the highly selective group of studies used for their analysis. It seems that the majority of the studies selected did not adjust for the covariates race, diet and exercise, which may be indicative of the quality of the selected studies. Other covariates were corrected for in most cases. It is unclear why the authors chose to adjust for all of these covariates instead of meta-analysing good quality studies that did adjust for all covariates considered relevant.
The authors motivate their extensive adjustments by stating that removing any of these covariates will reduce the relative risk for alcohol intake. This was illustrated in the only figure featured in the paper. The authors illustrate the effect of adjustments made (included below).
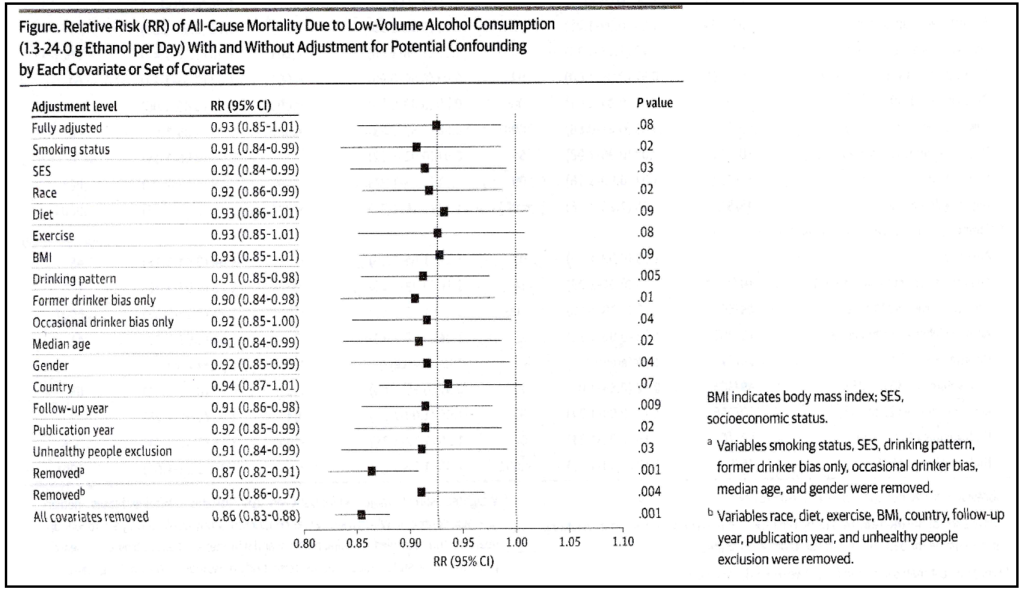
Therefore, leaving out adjustment for all covariates yielded a relative risk of 0.86 with a highly significant confidence interval of 0.83-0.88. Leaving out the covariates diet, exercise, BMI and country did, however, not significantly affect the fully-adjusted relative risk whereas other adjustments did. This information, which in itself is remarkable, did not change their analysis strategy. It has been known for a long time that adjustment for diet, for example, will affect the relative risk for wine drinkers (Tjønneland et al., 1999, Jani et al., 2021).
Also, without adjusting for country, relative risks do not change significantly as compared to the fully adjusted model. Country seems relevant, however, since drinking patterns vary with culture and country. Literature shows that health outcomes like total mortality and coronary heart disease are negatively affected when alcohol is taken as a binge as compared to regular moderate consumption.
Also, interesting to see in this figure that in the fully-adjusted model there is a change in relative risk. The numbers indicate a relative risk of 0.93 with a confidence interval of 0.85-1.01, whereas the figure shows a relative risk of 0.93 with a confidence interval not crossing the vertical line at 1, probably something like 0.86 – 0.99. This means that the fully-adjusted model produces a relative risk of 0.93, which is not significantly different from the unadjusted or partly adjusted models but still significantly lower than 1.
One wonders what the outcome would have been when the best adjusted papers were used for meta-analytical purposes rather than to adjust and use extensive modelling to derive at some theoretical relative risk that may or may not be true?
Concluding Forum comments
In the present study, the authors have resurrected the arguments that they and others raised decades ago. They express concern about, for example, the inclusion of sick quitters in the non-drinking population in an effort to demonstrate that epidemiologists have not properly adjusted for confounders in determining the presence of the J-shaped curve for cardiovascular diseases such as IHD and mortality. In fact, the issues raised by Fillmore et al. (2006) had been recognized by others in the field as early as 1995 and suitable corrections have been taken since then. The authors of this paper repeat themselves by quoting their previous and discredited paper by Fillmore et al. (2006) and 10-years later by Stockwell et al. (2016).
The 2014 meta-analysis by Roerecke and Rehm concluded that “For drinkers having one to two drinks per drinking day without episodic heavy drinking, there is substantial and consistent evidence from epidemiological and short-term experimental studies for a beneficial association with ischaemic heart disease (IHD) risk when compared to lifetime abstainers. The alcohol-IHD relationship fulfils all criteria for a causal association proposed by Hill.”
Even when Wood et al., (2018) in his extensive combined analysis in the Lancet eliminated non-drinkers from their analysis, their data still supported that individuals consuming more often than twice per week or engage in binge drinking, consumption of up to 200 g alcohol/week does not seem to increase mortality compared to non-drinkers.
The Forum, therefore, concludes that the overwhelming body of observational scientific data, as well as an immense number of experimental studies, support the contention that, for most middle-aged and older men and women who choose to do so, the regular consumption of small amounts of an alcoholic beverage can be considered as one of four or five additive components of a “healthy lifestyle.” Such a habit has been repeatedly shown to be associated with a lower risk of CVD and of total mortality (Spencer et al., 2005, Holahan et al., 2010, McCaul et al., 2010, Ford et al., 2011, Simons et al., 2011, Larsson et al., 2017, Barbarsko et al., 2018, Li et al., 2018, Ding et al., 2022). Ding et al. (2022) examining modifiable risk factors and longevity in 85 346 participants from the Nurses’ Health Study and the Health Professionals Follow-up Study, concludes that there is “important evidence” that maintaining healthy behaviours should be recommended to individuals through mid-life to late adulthood as well as at young ages.
Furthermore, the relationship between alcohol consumption and risk of death from all causes is complex where the reduced risk in death from cardiovascular disease is attenuated by the increased risk in death from cancers. A J-shaped relationship, however, is still observed between average lifetime alcohol consumption and death from all causes in the majority of studies.
Using average lifetime alcohol consumption would avoid the bias that occurs when separating former drinkers from current drinkers according to Stockwell et al., (2016). Accordingly, Kunzmann et al., (2018) used average lifetime alcohol consumption and observed J-shaped associations between average lifetime alcohol consumption and overall mortality, cardiovascular-related mortality, and combined risk of death or cancer. In comparison to lifetime light alcohol drinkers (1-3 drinks per week), lifetime never or infrequent drinkers (<1 drink/week), as well as heavy (2-<3 drinks/day) and very heavy drinkers (3+ drinks/day) were observed to have increased overall mortality and combined risk of cancer or death in other words again showing a J-shaped curve.
Furthermore, the US Health and Retirement Study has previously reported that moderate alcohol consumption independently confers reduced frailty risk for both older men and women (Shah et al. 2018), predicts fewer depressive symptoms among older adults (Paulson et al. 2018) where social interaction is essential to the seemingly beneficial effect of moderate alcohol consumption on depressive symptomatology and functional ability (Scott et al., 2018). Quality of life is relatively little considered factor in epidemiological studies of successful ageing and alcohol consumption, yet we know from the US Rancho Bernardo Study of Healthy Ageing and indeed from the Australian Dubbo Study of the Elderly, that a higher quality of life is associated with higher cognitive, mental and physical health and generally, longevity (Simons et al., 2006, Simons et al., 2014, Richards et al., 2017).
Specific comments from Forum members
Forum Member Stockley also comments that on page six of 17, Zhao et al. (2023) “claim that individuals aged 50 years or younger who were occasional moderate consumers of alcohol had an increased risk of mortality which increased linearly with amount compared with older individuals.” This is in contrast to data, however, that suggests the consumption of alcohol at a younger age does reduce the risk of CVD at a later age (Hvidfeldt et al., 2010) by modulating certain biomarkers for CVD (Power et al., 1998, Green et al., 2009, Wakabayashi and Araki, 2010, Okwuosa et al., 2013).
To date, no single risk factor has been identified to be responsible for causing CVD; rather, multiple interrelated factors seem responsible for its long-term development. Numerous traditional risk factors for CVD are related to diet and lifestyle. Such modifiable risk factors are present at, and develop from, adolescence and develop over many years until symptoms occur, generally in middle or older age (Hajar, 2017).
The US Coronary Artery Risk Development in Young Adults (CARDIA) and other subsequent studies have shown that early adolescent and young adult levels of modifiable risk factors for CVD, albeit low, were equally or more informative about coronary artery disease outcome in middle age than subsequent levels (Loria et al., 2007, Hartiala et al., 2012, Hartiala et al., 2016, Wilkins et al., 2016). This indicates that adolescent and young adult risk factor levels and activities that attenuate them, beneficially affect the pathogenesis of CHD and is associated with reduced CHD outcomes at middle and older age. Although the absolute risk is small in younger adults compared with middle-aged and older adults, light to moderate alcohol consumption but not heavy or excessive amounts and patterns in earlier ages will beneficially affect CVD and all-cause disease outcomes at older age.
Forum Member Ellison considers that “this paper is especially of interest since its reported results do not support the J-shaped curve seen in essentially all well-done cohort studies in western populations. Unfortunately, it represents a biased attempt to condemn all alcohol consumption through manipulation of collected data. In my opinion, there are two key problems with these analyses. The first is the use of only reported alcohol consumption without adjustments for pattern of drinking (regularly versus only on weekends, with/without food, with/without binge drinking, etc.). Simply using the total reported alcohol intake of a subject without knowing the pattern of drinking is insufficient for estimating its health consequences. In comparison with lifetime abstinence, regular moderate drinking with food has been shown consistently to decrease the risk of most health outcomes, including total mortality. The multiple and often unusual adjustment factors used in the present extensive analyses only confuse the picture. An even bigger problem is the combination of subjects from many different cultures for estimating an effect. The best estimates of the health effects related to alcohol consumption are available from large, well-done cohort studies within a defined population (as in nurses, health professionals, etc.) where striking cultural and socioeconomic differences are minimal. In every very large cohort study with adequate adjustments for drinking pattern and such factors, moderate drinkers are found consistently to live longer than lifetime abstainers. Combining data from many different cultures does not produce results that can be applied to any single group or individual, and is not useful for setting drinking guidelines for any population.
Forum members de Gaetano with Augusto Di Castelnuovo highlighted that “One of the new included 20 studies was that of Di Castelnuovo et al. (2021). Zhao et al. 2023 wrongly cited data from this paper (quoted). Zhao et al. (2023) largely based their conclusions by computing adjusted effects based on Meta-Regression Models. The overall relative risks (RRs) for each consumption category are derived from a weighted and adjusted model for a range of potential covariates. However, the Authors do not explain how the adjusted RR value is derived. For which values of the covariates is the overall risk (for each consumption category) calculated? Is it based on the reference value of each covariate? On the unbiased or ideal value? The mean value of the covariate?
While it would make sense to calculate the overall RR for certain “optimal” levels of some covariates (such as choosing the unbiased level for the “Abstainer biases” covariate or the “adjusted yes” level for covariates like “Control for smoking or race etc.”), it is unclear for which level the overall risk should be calculated for covariates such as “Countries” or “Publication year” or “Follow-up years”. The estimation of the overall relative risk depends on the value that has been fixed for each covariate. The absence of this information makes the “adjusted” results reported in the paper difficult to use and interpret.”
Forum member Skovenborg states that “a well-designed meta-analysis can provide valuable information for researchers, policymakers, and clinicians. However, there are many critical caveats in performing and interpreting them, and thus many ways in which meta-analyses can yield misleading information. Meta-analysis is powerful but also controversial— controversial because several conditions are critical to a sound meta-analysis, and small violations of those conditions can lead to misleading results (Walker et al., 2008). In the following we have listed a number of bias and limitations in the meta-analysis of Zhao et al., (2023).
Skovenborg goes on to say that confirmation bias, also called confirmatory bias or myside bias, is a tendency for people to favor information that confirms their preconceptions or hypotheses regardless of whether the information is true. Biased interpretation has been invoked to explain attitude polarization ─ when a disagreement becomes more extreme even though the different parties are exposed to the same evidence, and belief perseverance ─ when beliefs persist after the evidence for them is shown to be false (Plous, 1993). The list of references includes the 107 cohort studies selected for the meta-analysis, and of the remaining 32 references, seven (21.8%) are studies published by one or more of the authors.
The most obvious example of confirmation bias is the analytical bias regarding the draconian strict definition of lifetime abstainer. “The study defined that lifetime nondrinkers or lifetime abstainers were those who never drank one drink in their lifetime” ─ e.g. studies with any level of occasional lifetime drinking like “less than 12 drinks” or “rarely” or “hardly ever drinking”. Types of misclassification error of abstainer/drinker categories: classification of studies on basis of whether the abstainer category includes former or occasional drinkers: a) abstainers contaminated by both occasional drinkers and former drinkers, b) abstainers contaminated by occasional drinkers only, c) abstainers contaminated by former drinkers only and d) abstainers not contaminated by either occasional drinkers or former drinkers.” The Forum agrees that only including those studies that claim to have used lifetime nondrinkers or lifetime abstainers is still no guarantee that hardly ever drinkers or rarely drinkers were excluded. Also, excluding the majority of available studies on the basis of a term used by authors, but not checking similarities and differences between definitions for these terms, may not only turn out to be erroneous, but may generate more confusion and unnecessarily limits the use of the good quality data available.
“When the “abstainers” were considered as the reference group in the original studies and considered contaminated by former drinkers or active drinkers, which were usually occasional or light drinkers, the RR estimates for drinkers were considered the biased estimates and thus an adjustment was needed.” Actually Zhao et al., (2023) “reran their analysis using occasional drinkers (<1 drink per week) as the reference, for whom physiological health benefits are unlikely.” Only 21 of the 107 studies were deemed “free from abstainer bias”, however, the arbitrary adjustment of studies with any level of “occasional drinking”, whether it is <1 drink per week or a couple of drinks per year, is influenced by the authors’ personal opinions and neither sensible nor evidence-based. “Our rationale for this strict criterion is that self–reported infrequent drinkers have been shown to greatly under report their personal consumption [31,32]”, the authors write in the Supplemental Online Content. The conclusions of ref. 32 was that spirits consumption was underestimated by 65.94% compared with sales data, wine by 38.35% and beer by 49.02%. “After adjusting for Q (quantity) and F (frequency) values accordingly, regression analyses found alcohol consumption to be underestimated significantly more by younger drinkers (e.g., 82.9±1.19% for underage drinkers vs 70.38±1.54% for those 65+, p<0.001) and by low risk more than high risk drinkers (76.25±0.34% vs 49.22 ±3.01%, p<0.001).” The conclusion of ref. 32 was the importance of recall bias: “Survey estimates assessing annual alcohol volume, particularly estimates derived from usual-frequency and quantity measures, have consistently been found to account for only a fraction of per capita consumption from sales data. Our results suggest that the bias is more likely among persons with a less consistent drinking pattern, who may thus have more difficulty recalling their drinking over time, particularly over an assessment period as long as 12 months”. Some readers would argue that the evidence from ref. 31 and 32 was inadequate and of questionable relevance to substantiate the strict criterion for lifetime abstention.”
He goes to explain that “full adjustments according to the strict criteria had the effect of eliminating the mortality risk difference between occasional, low-volume and medium-volume drinkers. In the fully adjusted model, mortality RR estimates increased for all drinking categories, becoming nonsignificant for low-volume drinkers (RR, 0.93; 95%CI, 0.85-1.01; P = .07), occasional drinkers (>0 to <1.3 g of ethanol per day; RR, 0.96; 95%CI, 0.86-1.06; P = .41), and drinkers who drank 25 to 44 g per day (RR, 1.05; 95%CI, 0.96-1.14; P = .28). Considering that three of the authors are members of the Low-Risk Alcohol Drinking Guidelines Scientific Expert Panel (limiting low-risk alcohol intake to 1 to 2 standard drinks per week) the result that a daily intake of 25 to 44 g of alcohol per day is not significantly associated with mortality is noteworthy to say the least.
The authors deserve praise for the figure on page six that illustrates the relative risk of all-cause mortality due to low-volume alcohol consumption (1.3 – 24.0 g ethanol per day) with and without adjustment for potential confounding. Pooled unadjusted estimates (724 observations) showed significantly lower risk for low-volume drinkers (RR, 0.85; 95%CI, 0.81-0.88; P = .001) compared with abstainers as defined in the included studies. P-value massage with potential confounding factors like “occasional drinker bias” or “Publication year” was able to make the mortality risk reduction associated with low-volume alcohol intake non-significant as was the full adjustment: RR 0.93 (95% CI 0.85-1.01).
Statistical tests should never, however, constitute the sole input to inferences or decisions about associations or effects. Among the many reasons are that, in most scientific settings, the arbitrary classification of results into ‘‘significant’’ and ‘‘non-significant’’ is unnecessary for and often damaging to valid interpretation of data; and that estimation of the size of effects and the uncertainty surrounding our estimates will be far more important for scientific inference and sound judgment than any such classification (Greenland et al., 2016). The practice that judges study results according to whether a P-value exceeds or does not exceed a standard, yet arbitrary, cutoff value should be discouraged. One must look at the confidence interval to determine which effect sizes of scientific or clinical importance are relatively compatible with the data, given the model. Apart from the results of P-values massage, on page 18 of the Supplemental Online Content you will find eFigure 4 with a fully significant (and fully adjusted) J-shaped curve association of alcohol intake and all-cause mortality.
Forum Member Finkel considers that, as has been previously pointed out, omissions in previously published work likewise give only an incomplete picture, but that was then, this is now.
Forum Member Teissedre adds that “it is very dangerous to draw conclusions with biased results: Are the data adequate to support the authors’ interpretations/conclusions? Manifestly not for this study. Are the results generalizable? Manifestly not for this study This study is to put in the low-quality studies. Because of studies like this the public is forced to take into account the fact that a white coat does not guarantee success, or even sometimes the honesty of the wearer. A biased view of science is dangerous.”
Forum member Mattivi considers that “most people experience and learn from their mistakes. Sometimes, those who make mistakes even return to the site of their misdeeds to try to make things right, to try to erase the past. It is unusual and surprisingly disappointing to return to repeat the same mistakes. A critical comment such as this one we are making serves to teach those with the ability to work with rigour the correct way. Fortunately, the most intelligent learn from the mistakes of others. This criticism is for them.”
Forum Member Estruch muses that “a biased selection of studies is included in the meta-analysis that undermines the value of the paper. In addition, errors in the interpretation of statistical significance in the Figure 1 indicates bad faith. More important, the conclusion goes against the results of hundreds of studies that found that moderate alcohol consumption decrease overall mortality and protects against cardiovascular disease. In addition, the results of animal experiments and human trials have demonstrated the mechanisms underlying the protective effects of moderate alcohol consumption on all cardiovascular risk factors, adding plausability to the conclusions obtained in epidemiological studies.”
Forum Member Djousse suggests that “scientific inference suffers greatly when objective reporting of data is ignored by some authors”.
Forum summary
Zhao et al. (2023) again claims as did Stockwell et al. (2016) that “the importance of controlling for former drinker bias/misclassification is highlighted once more in our results which are consistent with prior studies showing that former drinkers have significantly elevated mortality risks compared with lifetime abstainers”. This statement clearly contradicts their e-Figure 4 which shows a J-shaped relationship between alcohol consumption and all-cause mortality, such that, as succinctly summarised by Forum Member Djousse, “scientific inference suffers greatly when objective reporting of data is ignored by some authors”. Zhao’s claim was made based on just 20 additional papers included in their analysis which carefully excluded hundreds of validated studies showing reduced disease and all-cause mortality among moderate drinkers, as well as choosing occasional drinkers as the reference group.
The key features that clearly demonstrate bias in the present paper are:
1. This is the third attempt by the same group of researchers to disprove the beneficial relationship between light to moderate alcohol consumption and cardiovascular health. The first attempt (Fillmore et al, in 2006) was discredited by reanalysis of the studies. Reanalysis showed that after adjusting for the claimed bias the cardioprotective effect for regular light to moderate alcohol consumption was still apparent.
2. Numerous meta-analyses have been undertaken over the past 15 years that have adjusted for this proposed bias and they have consistently shown that there is a cardioprotective effect for regular light to moderate alcohol consumption.
3. In this new paper, Zhao et al., (2023) have again biased their meta-analysis by ‘cherry picking’ a small number of studies for their meta-analysis – they discarded 3230 studies and analysed only 107. The 107 studies selected did relate consumption to disease and all-cause mortality but the authors carefully avoided hundreds of validated studies that showed reduced disease risk among light to moderate drinkers.
4. Countless animal and human studies over the past four decades have provided extensive evidence for the biological mechanisms supporting the findings that light to moderate alcohol consumption is cardioprotective. Zhao et al., (2023) seem to have deliberately pretended that they do not exist.
Forum Member Skovenborg succinctly summaries this flawed further meta-analysis by the Canadian Institute for Substance Use Research group to discredit the positive association between regular low to moderate alcohol consumption and all-cause mortality as follows: “a well-designed meta-analysis can provide valuable information for researchers, policymakers, and clinicians. However, there are many critical caveats in performing and interpreting them, and thus many ways in which meta-analyses can yield misleading information. Meta-analysis is powerful but also controversial— controversial because several conditions are critical to a sound meta-analysis, and small violations of those conditions can lead to misleading results (Walker et al. 2008).”
References
Barbaresko. J., Rienks, J., Nöthlings, U. (2018) Lifestyle indices and cardiovascular disease. Risk: a meta-analysis. American Journal of Preventative Medicine, 55(4):555-564.
Barbería-Latasa, M., Bes-Rastrollo, M., Pérez-Araluce, R. et al. (2022) Mediterranean Alcohol-Drinking Patterns and All-Cause Mortality in Women More Than 55 Years Old and Men More Than 50 Years Old in the “Seguimiento Universidad de Navarra” (SUN) Cohort. Nutrients, 14(24):5310. doi: 10.3390/nu14245310. PMID: 36558468
Bergman, S., Symeonidou, S., Andersson, M.L. et al. (2013) Alcohol consumption is associated with lower self-reported disease activity and better health-related quality of life in female rheumatoid arthritis patients in Sweden: data from BARFOT, a multicenter study on early RA. BMC Musculoskeletal Disorders,14, 218. https://doi.org/10.1186/1471-2474-14-218
Bobak, M., Malyutina, S., Horvat, P., et al. (2016). Alcohol, drinking pattern and all-cause, cardiovascular and alcohol-related mortality in Eastern Europe. European Journal of Epidemiology, 31(1), 21–30. https://doi.org/10.1007/S10654-015-0092-8
Boutitie, F., Gueyffier, F., Pocock, S., et al. (2002). J-shaped relationship between blood pressure and mortality in hypertensive patients: new insights from a meta-analysis of individual-patient data. Annals of Internal Medicine, 136(6), 438–448. https://doi.org/10.7326/0003-4819-136-6-200203190-00007
Brien, S.E., Ronksley, P.E., Turner, B.J., et al. (2011). Effect of alcohol consumption on biological markers associated with risk of coronary heart disease: systematic review and meta-analysis of interventional studies. British Medical Journal, 342, d636. https://doi.org/10.1136/bmj.d636
Bryazka, D., Reitsma, M.B., Griswold, M.G., et al. (2022). Population-level risks of alcohol consumption by amount, geography, age, sex, and year: a systematic analysis for the Global Burden of Disease Study 2020. Lancet (London, England), 400(10347), 185–235. https://doi.org/10.1016/S0140-6736(22)00847-9.
Colpani ,V., Baena, C.P., Jaspers, L., et al. (2018) Lifestyle factors, cardiovascular disease and all-cause mortality in middle-aged and elderly women: a systematic review and meta-analysis. European Journal of Epidemiology, pre-publication. https://doi.org/10.1007/s10654-018-0374-z
Cullen, K.J., Knuiman, M.W., & Ward, N. J. (1993). Alcohol and mortality in Busselton, Western Australia. American Journal of Epidemiology, 137(2), 242-248.
Daya, N.R., Rebholz, C.M., Appel, L.J., et al. (2020) Alcohol consumption and risk of hospitalizations and mortality in the atherosclerosis risk in communities study. Alcohol: Clinical and Experimental Research, 44(8):1646-1657. doi:10.1111/ acer.14393
Di Castelnuovo, A., Costanzo, S., Bagnardi, V., et al. (2006). Alcohol dosing and total mortality in men and women: an updated meta-analysis of 34 prospective studies. Archives of Internal Medicine, 166(22), 2437–2445. https://doi.org/10.1001/ARCHINTE.166.22.2437
Di Castelnuovo, A., Costanzo, S., Bonaccio, M., et al. (2022). Alcohol intake and total mortality in 142 960 individuals from the MORGAM Project: a population-based study. Addiction (Abingdon, England), 117(2), 312–325. https://doi.org/10.1111/ADD.15593
Di Castelnuovo, A., Rotondo, S., Iacoviello, L., et al. (2002). Meta-analysis of wine and beer consumption in relation to vascular risk. Circulation, 105(24), 2836–2844.
Ding, M., Fitzmaurice, G.M., Arvizu, M, et al. (2022) Associations between patterns of modifiable risk factors in mid-life to late life and longevity: 36-year prospective cohort study. British Medical Journal, 1(1):e000098. doi: 10.1136/bmjmed-2021-000098. PMID: 36936601; PMCID: PMC9978682.
Ferrari, P., Licaj, I., Muller, D.C., et al. (2014) Lifetime alcohol use and overall and cause-specific mortality in the European Prospective Investigation into Cancer and nutrition (EPIC) study. BMJ Open, 4:e005245. doi: 10.1136/bmjopen-2014-005245
Fillmore, K., Kerr, W., Stockwell, T. et al. (2006) Moderate alcohol use and reduced mortality risk: systematic error in prospective studies. Addiction Research and Theory, 14:101–132.
Fillmore, K. M., Stockwell, T., Chikritzhs, T., et al. (2007). Moderate alcohol use and reduced mortality risk: systematic error in prospective studies and new hypotheses. Annals of Epidemiology, 17(5 Suppl). https://doi.org/10.1016/J.ANNEPIDEM.2007.01.005
Ford, E.S., Zhao, G., Tsai, K., Li, C. (2011). Low-risk lifestyle behaviors and all-cause mortality: findings from the National Health and Nutrition Examination Survey III Mortality Study. American Journal of Public Health, 101:1922–1929.
Friesema, I.H., Zwietering, P.J., Veenstra, M.Y., et al. (2008). The effect of alcohol intake on cardiovascular disease and mortality disappeared after taking lifetime drinking and covariates into account. Alcoholism: Clinical and Experimental Research, 32(4), 645-651.
Green, D., Foiles, N., Chan, C., et al. (2009) Elevated fibrinogen levels and subsequent subclinical atherosclerosis: the CARDIA Study. Atherosclerosis, 202(2): 623-631.
Greenland, S., Senn, S.J., Rothman, K.J., et al. (2016) Statistical tests, P values, confidence intervals, and power: a guide to misinterpretations. European Journal of Epidemiology, 31:337-50.
Griswold, M.G., Fullman, N., Hawley, C., et al. (2018). Alcohol use and burden for 195 countries and territories, 1990-2016: a systematic analysis for the Global Burden of Disease Study 2016. Lancet (London, England), 392(10152), 1015–1035. https://doi.org/10.1016/S0140-6736(18)31310-2
Hajar, R. (2017) Risk Factors for Coronary Artery Disease: Historical Perspectives. Heart Views, 18(3):109-114. doi: 10.4103/HEARTVIEWS.HEARTVIEWS_106_17. PMID: 29184622; PMCID: PMC5686931.
Härkänen, T., Kuulasmaa, K., Sares-Jäske, L., et al. (2020) Estimating expected life-years and risk factor associations with mortality in Finland: cohort study. BMJ Open, 10:e033741. doi: 10.1136/bmjopen-2019-033741
Hartiala, O., Magnussen, C.G., Kajander, S., et al. (2012). Adolescence risk factors are predictive of coronary artery calcification at middle age: the cardiovascular risk in young Finns study. Journal of American College of Cardiology, 60(15):1364-1370.
Hartiala, O., Kajander, S., Knuuti, J., et al. (2016). Life-course risk factor levels and coronary artery calcification. The Cardiovascular Risk in Young Finns Study. International Journal of Cardiology, 225:23-29.
Hendriks, H.F.J. (2020). Alcohol and Human Health: What Is the Evidence? Annual Review of Food Science and Technology, 11(1), 1–21. https://doi.org/10.1146/annurev-food-032519-051827
Holahan, C.J., Schutte, K.K., Brennan, P.L., et al. (2010). Late-life alcohol consumption and 20-year mortality. Alcohol: Clinical and Experimental Research, 34:1961–1971.
Huang, C., Zhan, J., Liu, Y.J., et al. (2014) Association between alcohol consumption and risk of cardiovascular disease and all-cause mortality in patients with hypertension: a meta-analysis of prospective cohort studies. Mayo Clinical Proceedings, 89(9):1201-10. doi: 10.1016/j.mayocp.2014.05.014. Epub 2014 Aug 1. PMID: 25091872.
Jankhotkaew, J., Bundhamcharoen, K., Suphanchaimat, R., et al. (2020) Associations between alcohol consumption trajectory and deaths due to cancer, cardiovascular diseases and all-cause mortality: a 30-year follow-up cohort study in Thailand. BMJ Open, 10(12):e038198. doi:10.1136/bmjopen-2020-038198
Jani, B.D., McQueenie, R., Nicholl, B.I. et al. (2021) Association between patterns of alcohol consumption (beverage type, frequency and consumption with food) and risk of adverse health outcomes: a prospective cohort study. BMC Med, 19, 8. https://doi.org/10.1186/s12916-020-01878-2
Jayasekara, H., MacInnis ,R.J., Hodge, A.M., et al. (2015) Alcohol consumption for different periods in life, intake pattern over time and all-cause mortality. Journal of Public Health (Oxf), 37(4):625-633.
Kaprio, J., Latvala, A., Rose, R. (2019) Longitudinal patterns of alcohol use and mortality: a 40 year follow-up of the Finnish twin cohort. European Neuropsychopharmacology, 29(Suppl 3):S804. doi:10.1016/j.euroneuro.2017.08.043
Keyes, K.M., Calvo, E., Ornstein, K.A., et al. (2019) Alcohol Consumption in Later Life and Mortality in the United States: Results from 9 Waves of the Health and Retirement Study. Alcoholism: Clinical and Experimental Research, 43:1734-1746.
Klatsky, A.L., Udaltsova, N. (2007) Alcohol drinking and total mortality risk. Annals of Epidemiology, 17(5, Supplement 1): S63-S67.
Kono, S., Ikeda, M., Tokudome, S., et al. (1986). Alcohol and mortality: a cohort study of male Japanese physicians. International Journal of Epidemiology, 15(4), 527-532.
Kunzmann, A.T., Coleman, H.G., Huang, W.-Y., Berndt, S.I. (2018) The association of lifetime alcohol use with mortality and cancer risk in older adults: A cohort study. PLoS Med, 15:e1002585. https://doi.org/10.1371/journal.pmed.1002585.
Larsson, S.C., Drca, N., Wolk, A. (2014). Alcohol consumption and risk of atrial fibrillation: a prospective study and dose-response meta-analysis. Journal of the American College of Cardiology, 64(3), 281-289.
Lee, S.J., Sudore, R.L., Williams, B.A., et al. (2009) Functional limitations, socioeconomic status, and all-cause mortality in moderate alcohol drinkers. Journal of American Geriatric Society, 57:955–962.
Li, J., Wang, H., Li, M., et al. (2020) Effect of alcohol use disorders and alcohol intake on the risk of subsequent depressive symptoms: a systematic review and meta-analysis of cohort studies. Addiction, 115(7):1224-1243. doi: 10.1111/add.14935. Epub 2020 Jan 16. PMID: 31837230.
Li, Y., Pan, A., Wang, D.D., et al. (2018) Impact of Healthy Lifestyle Factors on Life Expectancies in the US Population. Circulation. 137:00–00. (Pre-publication). DOI: 10.1161/CIRCULATIONAHA.117.032047.
Liu, X., Zhang, D., Liu, Y., et al. (2018). A J-shaped relation of BMI and stroke: Systematic review and dose-response meta-analysis of 4.43 million participants. Nutrition, Metabolism, and Cardiovascular Diseases: NMCD, 28(11), 1092–1099. https://doi.org/10.1016/J.NUMECD.2018.07.004
Loria, C.M., Liu, K., Lewis, C.E., et al. (2007) Early adult risk factor levels and subsequent coronary artery calcification: the CARDIA Study. Journal of American College of Cardiology, 49(20):2013-2020.
Makelä, P., Paljärvi, T., Poikolainen, K. (2005). Heavy and nonheavy drinking occasions, all-cause and cardiovascular mortality and hospitalizations: a follow-up study in a population with a low consumption level. Journal of Studies on Alcohol, 66(6), 722-728.
Mayer-Davis, E., Leidy, H., Mattes, R., et al. (2020) Alcohol Consumption and All-Cause Mortality: A Systematic Review. July 2020. U.S. Department of Agriculture, Food and Nutrition Service, Center for Nutrition Policy and Promotion, Nutrition Evidence Systematic Review. Available at: https://doi.org/10.52570/NESR.DGAC2020.SR0403.
McCaul, K.A., Almeida, O.P., Hankey, G.J., et al. (2010). Alcohol use and mortality in older men and women. Addiction. 105(8):1391-1400.
Okwuosa, T.M., Klein, O., Chan, C., et al. (2013) Long-term change in alcohol-consumption status and variations in fibrinogen levels: the coronary artery risk development in young adults (CARDIA) study. British Medical Journal, 3(7). pii: e002944. doi: 10.1136/bmjopen-2013-002944.
Paulson, D., Shah, M., Herring, D., et al. (2018) The relationship between moderate alcohol consumption, depressive symptomatology, and C-reactive protein: the Health and Retirement Study. International Journal of Geriatric Psychiatry, 33:316-324.
Perreault, K., Bauman, A., Johnson, N., et al. (2017). Does physical activity moderate the association between alcohol drinking and all-cause, cancer and cardiovascular diseases mortality? A pooled analysis of eight British population cohorts. British Journal of Sports Medicine, 51(8), 651-657.
Plous S. The Psychology of Judgment and Decision Making. McGraw-Hill, 1993.
Power C, Rodgers B, Hope S. (1998) U-shaped relation for alcohol consumption and health in early adulthood and implications for mortality Lancet, 352: 877.
Rehm, J., Greenfield, T. K., Rogers, J.D. (2001). Average volume of alcohol consumption, patterns of drinking, and all-cause mortality: results from the US National Alcohol Survey. American Journal of Epidemiology, 153(1), 64-71.
Richard, E.L., Kritz-Silverstein, D., Laughlin, G.A., et al. (2017) Alcohol Intake and Cognitively Healthy Longevity in Community-Dwelling Adults: The Rancho Bernardo Study. Journal of Alzheimer’s Disease, 59(3):803-814.
Roerecke, M., Rehm, J. (2014) Alcohol consumption, drinking patterns, and ischemic heart disease: a narrative review of meta-analyses and a systematic review and meta-analysis of the impact of heavy drinking occasions on risk for moderate drinkers. BMC Medicine, 12:182.
Ronksley, P. E., Brien, S. E., Turner, B. J., et al. (2011). Association of alcohol consumption with selected cardiovascular disease outcomes: a systematic review and meta-analysis, British Medical Journal , 342, d671. https://doi.org/10.1136/bmj.d671
Russell, M., Fan, A.Z., Freudenheim, J.L., et al. (2019) Lifetime drinking trajectories and nonfatal acute myocardial infarction. Alcohol: Clinical Experimental Research, 43(11):2384-2394.
Saito, E., Inoue, M., Sawada, N., et al. (2018) Impact of alcohol intake and drinking patterns on mortality from all causes and major causes of death in a Japanese population. Journal of Epidemiology. 28(3):140-148. doi:10.2188/jea. JE20160200
Sadakane, A., Gotoh, T., Ishikawa, S., et al. (2009) Amount and Frequency of Alcohol Consumption and All-Cause Mortality in a Japanese Population: The JMS Cohort Study, Journal of Epidemiology, 19(3):107-115 doi:10.2188/jea.JE20081003
Scott, R.G., Wiener, C.H., Paulson, D. (2018) The Benefit of Moderate Alcohol Use on Mood and Functional Ability in Later Life: Due to Beers or Frequent Cheers? Gerontologist. doi: 10.1093/geront/gny129.
Shah, M., Paulson, D., Nguyen, V. (2018) Alcohol Use and Frailty Risk among Older Adults over 12 Years: The Health and Retirement Study. Clinical Gerontology, 41:315-325.
Sim, J.J., Shi, J., Kovesdy, C.P., et al. (2014). Impact of achieved blood pressures on mortality risk and end-stage renal disease among a large, diverse hypertension population. Journal of the American College of Cardiology, 64(6), 588-597.
Simons, L.A. (2014) Alcohol intake and survival in Australian seniors: The Dubbo Study. Nutrition and Aging, 2(2-3):85-90.
Simons, L.A. et al. (2011) Predictors of long-term mortality in the elderly: the Dubbo Study. International Medical Journal, 41(7): 555-560.
Simons, L.A., Simons, J., McCallum, J., Friedlander, Y. (2006) Lifestyle factors and risk of dementia: Dubbo Study of the elderly. Medical Journal Australia, 184 (2): 68-70. doi: 10.5694/j.1326-5377.2006.tb00120.x
Simons, L.A., et al., (2000) Moderate alcohol intake is associated with survival in the elderly: the Dubbo Study. Medical Journal of Australia, 173(3): 121-124.
Song, R.J., Nguyen, X.M.T., Quaden, R., et al. (2018). Alcohol Consumption and Risk of Coronary Artery Disease (from the Million Veteran Program). The American Journal of Cardiology, 121(10), 1162–1168. https://doi.org/10.1016/J.AMJCARD.2018.01.042
Spencer, C.A., Jamrozik, K., Norman, P.E., Lawrence-Brown, M. (2005). A simple lifestyle score predicts survival in healthy elderly men. Preventative Medicine, 40:712–717.
Stockwell, T., Zhao, J., Panwar, S., et al. (2016). Do “moderate” drinkers have reduced mortality risk? A systematic review and meta-analysis of alcohol consumption and all-cause mortality. Journal of Studies on Alcohol and Drugs, 77(2), 185-198.
Sun, Q., Townsend, M.K., Okereke, O.I. et al. (2011). Alcohol consumption at midlife and successful ageing in women: a prospective cohort analysis in the Nurses’ Health Study. PLoS Med 8:e1001090.
Sydén, L., Landberg, J. (2017) The contribution of alcohol use and other lifestyle factors to socioeconomic differences in all-cause mortality in a Swedish cohort. Drug and Alcohol Review, 36(5):691-700. doi:10.1111/dar.12472
Thun, M.J., Peto, R., Lopez, A.D., et al. (1997). Alcohol consumption and mortality among middle-aged and elderly US adults. New England Journal of Medicine, 337(24), 1705-1714.
Tjønneland, A., Grønbœk, M., Stripp, C., Overvad, K. (1999). Wine intake and diet in a random sample of 48763 Danish men and women. The American Journal of Clinical Nutrition, 69(1), 49–54. https://doi.org/10.1093/AJCN/69.1.49
Tsubono, Y., Fukao, A., Hisamichi, S. (1993). Health practices and mortality in a rural Japanese population. The Tohoku Journal of Experimental Medicine, 171(4), 339-348.
van den Brandt, P.A., Brandts, L. (2020) Alcohol consumption in later life and reaching longevity: the Netherlands Cohort Study. Age and Ageing. 49(3):395-402. doi: 10.1093/ageing/afaa003. PMID: 32037449; PMCID: PMC7187870.
van de Luitgaarden, I.A.T., Schrieks, I.C., Kieneker, L.M., et al. (2020) Urinary ethyl glucuronide as measure of alcohol consumption and risk of cardiovascular disease: a population-based cohort study. Journal of American Heart Association, 9(7): e014324. doi:10.1161/JAHA.119.014324.
Wakabayashi, I., Araki, Y. (2010) Influences of gender and age on relationships between alcohol drinking and atherosclerotic risk factors. Alcohol: Clinical and Experimental Research, 34(Suppl 1): S54-60.
Walker, E., Hernandez, A.V., Kattan, M.W. (2008) Meta-analysis: Its strengths and limitations. Cleveland Clinic Journal of Medicine, 75:431-9.
Wilkins, J.T., Li, R.C., Sniderman, A., et al. (2016) Discordance Between Apolipoprotein B and LDL-Cholesterol in Young Adults Predicts Coronary Artery Calcification: The CARDIA Study. Journal of American College of Cardiology, 67(2):193-201.
Wood, A. M., Kaptoge, S., Butterworth, A., et al. (2018). Risk thresholds for alcohol consumption: combined analysis of individual-participant data for 599 912 current drinkers in 83 prospective studies. Lancet (London, England), 391(10129), 1513–1523. https://doi.org/10.1016/S0140-6736(18)30134-X
Xi, B., Veeranki, S.P., Zhao, M., et al. (2017) Relationship of Alcohol Consumption to All-Cause, Cardiovascular, and Cancer-Related Mortality in U.S. Adults. Journal of American College of Cardiology, 70(8):913-922. doi: 10.1016/j.jacc.2017.06.054. Erratum in: J Am Coll Cardiol. 2017 Sep 19;70(12):1542. PMID: 28818200.
Zhang, X., Liu, Y., Li, S., et al. (2021) Alcohol consumption and risk of cardiovascular disease, cancer and mortality: a prospective cohort study. Nutrition Journal, 20(1):13. doi:10.1186/s12937-021-00671-y.
Comments on this critique by the International Scientific Forum on Alcohol Research were provided by the following members:
Fulvio Ursini, MD, Dept. of Biological Chemistry, University of Padova, Padova, Italy
Fulvio Mattivi, MSc, Head of the Department Food Quality and Nutrition, Research and Innovation Centre, Fondazione Edmund Mach, in San Michele all’Adige, Italy.
Pierre Louis Teissedre, PhD, Faculty of Oenology–ISVV, University Victor Segalen Bordeaux 2, Bordeaux, France
Giovani de Gaetano, MD, PhD, Department of Epidemiology and Prevention, IRCCS Istituto Neurologico Mediterraneo NEUROMED, Pozzilli, Italy
R Curtis Ellison, MD, Section of Preventive Medicine/Epidemiology, Boston University School of Medicine, Boston, MA, USA
Erik Skovenborg, MD, specialized in family medicine, member of the Scandinavian Medical Alcohol Board, Aarhus, Denmark
Luc Djousse, MD, DSc, Dept. of Medicine, Division of Aging, Brigham & Women’s Hospital and Harvard Medical School, Boston, MA, USA
Harvey Finkel, MD, Hematology/Oncology, Retired (Formerly, Clinical Professor of Medicine, Boston University Medical Center, Boston, MA, USA)
Andrew Waterhouse, PhD, Department of Viticulture and Enology, University of California, Davis.
Arne Svilass, Arne Svilaas, MD, PhD, general practice and lipidology, Oslo University Hospital, Oslo, Norway
Mladen Boban, MD, PhD, Professor and Head of the Department of Pharmacology, University of Split School of Medicine, Croatia
Dominique Lanzmann-Petithory, MD, PhD, Nutrition/Cardiology, Praticien Hospitalier Hôpital Emile Roux, Paris, France
Yuqing Zhang, MD, DSc, Clinical Epidemiology, Boston University School of Medicine; Massachusetts General Hospital, Harvard Medical School, Boston, MA, USA.
Ramon Estruch, MD, PhD. Associate Professor of Medicine, University of Barcelona, Spain
Henk Hendriks, PhD, Netherlands
Creina Stockley, PhD, MBA, Independent consultant and Adjunct Senior Lecturer in the School of Agriculture, Food and Wine at the University of Adelaide, Australia